Stakeholder-based Impact Scoring: Difference between revisions
No edit summary |
No edit summary |
||
| (21 intermediate revisions by the same user not shown) | |||
| Line 1: | Line 1: | ||
== General overview == | |||
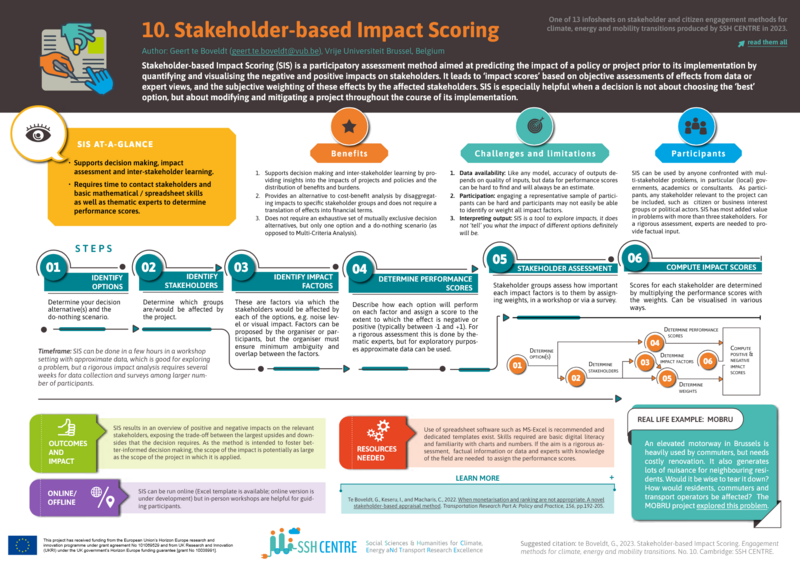
SIS is a method for quantifying and visualising the advantages and disadvantages of interventions on various stakeholders in a way as simple as possible. The principle behind the method is that performances of one or several project options, on several factors, are compared to a baseline. First, this is done ‘objectively’ with a performance score based on data or expert input. Secondly, stakeholders assign weights to each impact factor, reflecting their ‘subjective’ importance. By multiplying them, we can calculate, aggregate and visualise the negative and positive effects on different stakeholders, in order to compare different project options or to analyse the pros and cons of a single option | Stakeholder-based Impact Scoring (SIS) is a method for quantifying and visualising the advantages and disadvantages of interventions on various stakeholders in a way as simple as possible. The principle behind the method is that performances of one or several project options, on several factors, are compared to a baseline. First, this is done ‘objectively’ with a performance score based on data or expert input. Secondly, stakeholders assign weights to each impact factor, reflecting their ‘subjective’ importance. By multiplying them, we can calculate, aggregate and visualise the negative and positive effects on different stakeholders, in order to compare different project options or to analyse the pros and cons of a single option. | ||
It is important to note that SIS consists of both objective and subjective components, and therefore does not aim to identify a single objectively ‘best’ solution. SIS can thus be used as a dynamic dashboard that provides a quantified overview of the impacts of your project on different stakeholders, which you can adjust at any time based on new information and insights. For more information about the method and calculations, see [https://sshcentre.eu/activities/open-knowledge-platform/ssh-exploration-space/stakeholder-engagement-methods/stakeholder-based-impact-scoring/ this website] or [https://doi.org/10.1016/j.tra.2021.12.004 the article by te Boveldt et al. (2022)]. | |||
Practically, SIS can be done with dedicated software or with an Excel template. The software is faster and easier but the Excel template provides more possibilities to customise visuals and calculations. This manual contains instructions for both options. | |||
[[File:Infosheets-10-SSH-CENTRE-Stakeholder-based-Impact-Scoring.png|frameless|800x800px|link=Media:Infosheets-10-SSH-CENTRE-Stakeholder-based-Impact-Scoring.pdf]] | |||
<br><br> | |||
== The Manual == | |||
In short, SIS consists of the following steps: | In short, SIS consists of the following steps: | ||
=== 1. Formulate the problem and the intervention(s) === | |||
In this first step, describe the interventions you want to evaluate as precisely as possible. Compared to other MCA methods, SIS is quite flexible: you can have one or multiple interventions, they may but do not have to be mutually exclusive. Still, it is important that you also think of a baseline, reference, or do-nothing scenario that you want to evaluate the options against. The interventions may be formulated top-down, i.e., by the governmental institutions or other decision makers, or be the result of a co-creative process with the stakeholders. Enter the names of the interventions in the software or template. | |||
=== 2. Identify the stakeholders === | |||
Here, identify the individuals or groups that you find important to include in the evaluation. Who is likely to benefit or suffer as a result of the interventions? You may want to involve stakeholders for pragmatic reasons in the sense that you need their support for the project to succeed, or for moral reasons in the sense that you care about the fair distribution of benefits and burdens. In SIS, the main role of stakeholders is to assign weights to indicators (step 5). You can organise workshops, organise interviews or distribute a survey. For stakeholder groups that are too large to take everyone’s individual opinion into account, for example when involving all residents of a neighbourhood, the software and the Excel template provide the option to aggregate the weights of the members of a specific group and compute the average. If you want a higher degree of participation, you also might want to consult them for the other steps. You can do this through interviews or workshops, but there exists no official procedure for that. Enter the stakeholders in the software or templated. | |||
=== 3. Define indicators === | |||
The decision maker or the facilitator makes a list of the indicators on which the advantages or disadvantages of the interventions can be described and compared. In an urban renewal project, for example, indicators could include safety, noise, costs, visual appearance, air quality, etc. Enter the indicators in the software or template under the tab ‘impact factors’. | |||
The following points are important: | |||
* Relevance, clarity and non-ambiguity. Do the interventions have impact with respect the indicators and are they likely to be considered important by the stakeholders? Do the indicators help in comparing the interventions with each other or with the current situation? | |||
* Measurability or possibility to estimate impacts. Will it be possible to make a sensible estimation of the impact of the interventions with respect to the indicators? It can help to think of measurement units, although for very qualitative indicators this might be difficult. | |||
* Completeness. Cover all major aspects and be sure to address the elephants in the room, both the positive and the negative aspects. Be sure to include each stakeholder’s perspective. For example, when using ‘costs’, indicate who would bear them (e.g. local or national government or private parties). Some indicators might not be relevant for all stakeholders, but this is not a problem as stakeholders can give them zero importance in step 5. | |||
* But not too many. (Max. 10-12 factors) so the decision maker and stakeholder can keep the overview and the discussion focused. With If the list gets too long, you can combine multiple indicators in one ‘higher level’ indicators (e.g., ‘air quality’ instead of NOx, SO2, etc.).. | |||
* Avoid overlap because this lead to certain aspects being counted double. This could happen, for example, when you include ‘environmental impact’, and ‘CO2 emissions’ as well as climate impact. | |||
=== 4. Rate the performance of each intervention on each indicator === | |||
In this step each intervention is rated on each indicator as objectively and neutrally as possible. In the software or template, first, use existing data, modelling outputs, or expert input to describe the effects. For example, on the indicator ‘climate impact’ an intervention is estimated to lead to X amount of CO2 emissions/year. These descriptions do not affect the eventual result but are useful as a justification. Then, in the same tab in the software or template, do the normalisation, i.e. the translation of the effects into a comparable scale. The standard is a 7-point scale from -1 (most negative) to +1 (most positive), which indicates the intervention’s performance on the indicator in comparison to the baseline scenario (doing nothing or business as usual). It is easiest to base the normalisation on the judgements of experts. Normalisation is never fully objective, so you might want to consider to consult stakeholders for this, but it might be quite difficult for them to provide input. Note that this score indicates only the positivity or negativity of performance of the intervention on the indicator, but not the importance, which the stakeholders will indicate in the next step. | |||
=== 5. Stakeholders give weights to each indicator === | |||
In the software or template, the stakeholders assign weights to each indicator reflecting how important they find them. Each stakeholder has the possibility to a weight between 10 (maximum importance) and 0 (not important). A common approach is to start by identifying the most important factor and then rating the other factors relative to that one. It is possible for multiple factors to have the same weight. It is also possible that no factor receives the maximum weight. There are multiple possible ways to collect the weights from the stakeholders: through surveys, through interviews or through workshops. When sending a survey, make sure that you include all relevant information about your project. The SIS software has an option for sending survey emails directly to the stakeholders. | |||
=== 6. Calculate and analyse results === | |||
The SIS formula then computes impact scores by multiplying the performance scores (4) with the weights given by the stakeholders (5). Specific scores can be calculated for positive and negative effects, for each stakeholder individually or combined for multiple stakeholders. These impact scores show the negative and positive impacts. You can use these scores to compare different interventions or to analyse one intervention in detail. It can be important to know if there are any stakeholders disproportionately negatively affected, so to that these effects can be mitigated or compensated. | |||
Latest revision as of 09:25, 5 March 2026
General overview
Stakeholder-based Impact Scoring (SIS) is a method for quantifying and visualising the advantages and disadvantages of interventions on various stakeholders in a way as simple as possible. The principle behind the method is that performances of one or several project options, on several factors, are compared to a baseline. First, this is done ‘objectively’ with a performance score based on data or expert input. Secondly, stakeholders assign weights to each impact factor, reflecting their ‘subjective’ importance. By multiplying them, we can calculate, aggregate and visualise the negative and positive effects on different stakeholders, in order to compare different project options or to analyse the pros and cons of a single option.
It is important to note that SIS consists of both objective and subjective components, and therefore does not aim to identify a single objectively ‘best’ solution. SIS can thus be used as a dynamic dashboard that provides a quantified overview of the impacts of your project on different stakeholders, which you can adjust at any time based on new information and insights. For more information about the method and calculations, see this website or the article by te Boveldt et al. (2022).
Practically, SIS can be done with dedicated software or with an Excel template. The software is faster and easier but the Excel template provides more possibilities to customise visuals and calculations. This manual contains instructions for both options.
The Manual
In short, SIS consists of the following steps:
1. Formulate the problem and the intervention(s)
In this first step, describe the interventions you want to evaluate as precisely as possible. Compared to other MCA methods, SIS is quite flexible: you can have one or multiple interventions, they may but do not have to be mutually exclusive. Still, it is important that you also think of a baseline, reference, or do-nothing scenario that you want to evaluate the options against. The interventions may be formulated top-down, i.e., by the governmental institutions or other decision makers, or be the result of a co-creative process with the stakeholders. Enter the names of the interventions in the software or template.
2. Identify the stakeholders
Here, identify the individuals or groups that you find important to include in the evaluation. Who is likely to benefit or suffer as a result of the interventions? You may want to involve stakeholders for pragmatic reasons in the sense that you need their support for the project to succeed, or for moral reasons in the sense that you care about the fair distribution of benefits and burdens. In SIS, the main role of stakeholders is to assign weights to indicators (step 5). You can organise workshops, organise interviews or distribute a survey. For stakeholder groups that are too large to take everyone’s individual opinion into account, for example when involving all residents of a neighbourhood, the software and the Excel template provide the option to aggregate the weights of the members of a specific group and compute the average. If you want a higher degree of participation, you also might want to consult them for the other steps. You can do this through interviews or workshops, but there exists no official procedure for that. Enter the stakeholders in the software or templated.
3. Define indicators
The decision maker or the facilitator makes a list of the indicators on which the advantages or disadvantages of the interventions can be described and compared. In an urban renewal project, for example, indicators could include safety, noise, costs, visual appearance, air quality, etc. Enter the indicators in the software or template under the tab ‘impact factors’.
The following points are important:
- Relevance, clarity and non-ambiguity. Do the interventions have impact with respect the indicators and are they likely to be considered important by the stakeholders? Do the indicators help in comparing the interventions with each other or with the current situation?
- Measurability or possibility to estimate impacts. Will it be possible to make a sensible estimation of the impact of the interventions with respect to the indicators? It can help to think of measurement units, although for very qualitative indicators this might be difficult.
- Completeness. Cover all major aspects and be sure to address the elephants in the room, both the positive and the negative aspects. Be sure to include each stakeholder’s perspective. For example, when using ‘costs’, indicate who would bear them (e.g. local or national government or private parties). Some indicators might not be relevant for all stakeholders, but this is not a problem as stakeholders can give them zero importance in step 5.
- But not too many. (Max. 10-12 factors) so the decision maker and stakeholder can keep the overview and the discussion focused. With If the list gets too long, you can combine multiple indicators in one ‘higher level’ indicators (e.g., ‘air quality’ instead of NOx, SO2, etc.)..
- Avoid overlap because this lead to certain aspects being counted double. This could happen, for example, when you include ‘environmental impact’, and ‘CO2 emissions’ as well as climate impact.
4. Rate the performance of each intervention on each indicator
In this step each intervention is rated on each indicator as objectively and neutrally as possible. In the software or template, first, use existing data, modelling outputs, or expert input to describe the effects. For example, on the indicator ‘climate impact’ an intervention is estimated to lead to X amount of CO2 emissions/year. These descriptions do not affect the eventual result but are useful as a justification. Then, in the same tab in the software or template, do the normalisation, i.e. the translation of the effects into a comparable scale. The standard is a 7-point scale from -1 (most negative) to +1 (most positive), which indicates the intervention’s performance on the indicator in comparison to the baseline scenario (doing nothing or business as usual). It is easiest to base the normalisation on the judgements of experts. Normalisation is never fully objective, so you might want to consider to consult stakeholders for this, but it might be quite difficult for them to provide input. Note that this score indicates only the positivity or negativity of performance of the intervention on the indicator, but not the importance, which the stakeholders will indicate in the next step.
5. Stakeholders give weights to each indicator
In the software or template, the stakeholders assign weights to each indicator reflecting how important they find them. Each stakeholder has the possibility to a weight between 10 (maximum importance) and 0 (not important). A common approach is to start by identifying the most important factor and then rating the other factors relative to that one. It is possible for multiple factors to have the same weight. It is also possible that no factor receives the maximum weight. There are multiple possible ways to collect the weights from the stakeholders: through surveys, through interviews or through workshops. When sending a survey, make sure that you include all relevant information about your project. The SIS software has an option for sending survey emails directly to the stakeholders.
6. Calculate and analyse results
The SIS formula then computes impact scores by multiplying the performance scores (4) with the weights given by the stakeholders (5). Specific scores can be calculated for positive and negative effects, for each stakeholder individually or combined for multiple stakeholders. These impact scores show the negative and positive impacts. You can use these scores to compare different interventions or to analyse one intervention in detail. It can be important to know if there are any stakeholders disproportionately negatively affected, so to that these effects can be mitigated or compensated.